


Gold drops as hot CPI report boosts the US Dollar, increases Fed hold bets
- Gold falls as US CPI rises, reinforcing the current Fed’s policy stance and lifting the US Dollar.
- Trump announces Indonesia deal and demands interest rate cuts.
- Traders shift focus to PPI, Retail Sales and consumer sentiment data.
Gold price tumbled on Tuesday, down more than 0.40% following the release of the latest inflation report in the United States (US), which boosted the US Dollar to the detriment of the precious metal. Comments by US President Donald Trump and risk aversion, instead of driving Bullion prices higher, weighed on the precious metal, which trades at $3,329 after hitting a daily peak of $3,366.
The market mood is mixed, with US equities fluctuating between gains and losses following the release of the June Consumer Price Index (CPI). Headline and core figures on an annual basis rose, signaling that tariffs are beginning to push prices higher. Consequently, traders appear to be convinced that the Federal Reserve (Fed) will keep rates unchanged and await further data ahead of the September meeting, following the Jackson Hole Symposium.
Last weekend, the US President Donald Trump announced 30% tariffs on the European Union (EU) and Mexico. Initially, Gold prices rose, but traders faded the move and drove prices lower amid fears that an announcement of an agreement could be made within days or weeks.
Additionally, Trump remains active on social media and revealed a trade agreement with Indonesia. He was also vocal about the latest inflation report and demanded that the Federal Reserve lower interest rates.
Ahead this week, traders will eye inflation on the producer side, Retail Sales, jobs data and the University of Michigan Consumer Sentiment report.
Gold daily market movers: High US inflation boosts US Dollar, sent US yields higher
- Gold price drops but remains capped within the $3,300-$3,350 range as the US Dollar surges. The US Dollar Index (DXY), which tracks the buck’s value against a basket of six currencies, rises 0.55% to 98.64.
- The latest inflation report in the US revealed that June Consumer Price Index (CPI) rose 2.7% YoY, in line with expectations, while core CPI came in at 2.9%, slightly lower than the 3% consensus but still well above the Fed’s 2% target.
- Consequently, money markets had priced in less than 50 basis points (bps) of easing, with investors pricing in over 43 bps of rate cuts toward the end of the year.
- US Treasury yields had risen sharply, hence triggering a reduction in rate cuts by the Federal Reserve. The US 10-year Treasury yield, which usually correlates negatively with Gold, rises five basis points (bps) to 4.487%.
- US President Trump announced a trading deal with Indonesia, in which the latter will pay 19% of duties, while US products will be exempt from tariffs. He stated that similar deals are in the works, and that “Indonesia has committed to purchasing $15 Billion Dollars in US Energy, $4.5 Billion Dollars in American Agricultural Products, and 50 Boeing Jets, many of them 777’s.”
- Boston Fed Susan Collins said that achieving the bank’s mandates is about reaching the goals over a long period, adding that she does not know precisely where maximum employment is. She stated that there’s some evidence that the labor market is cooling.
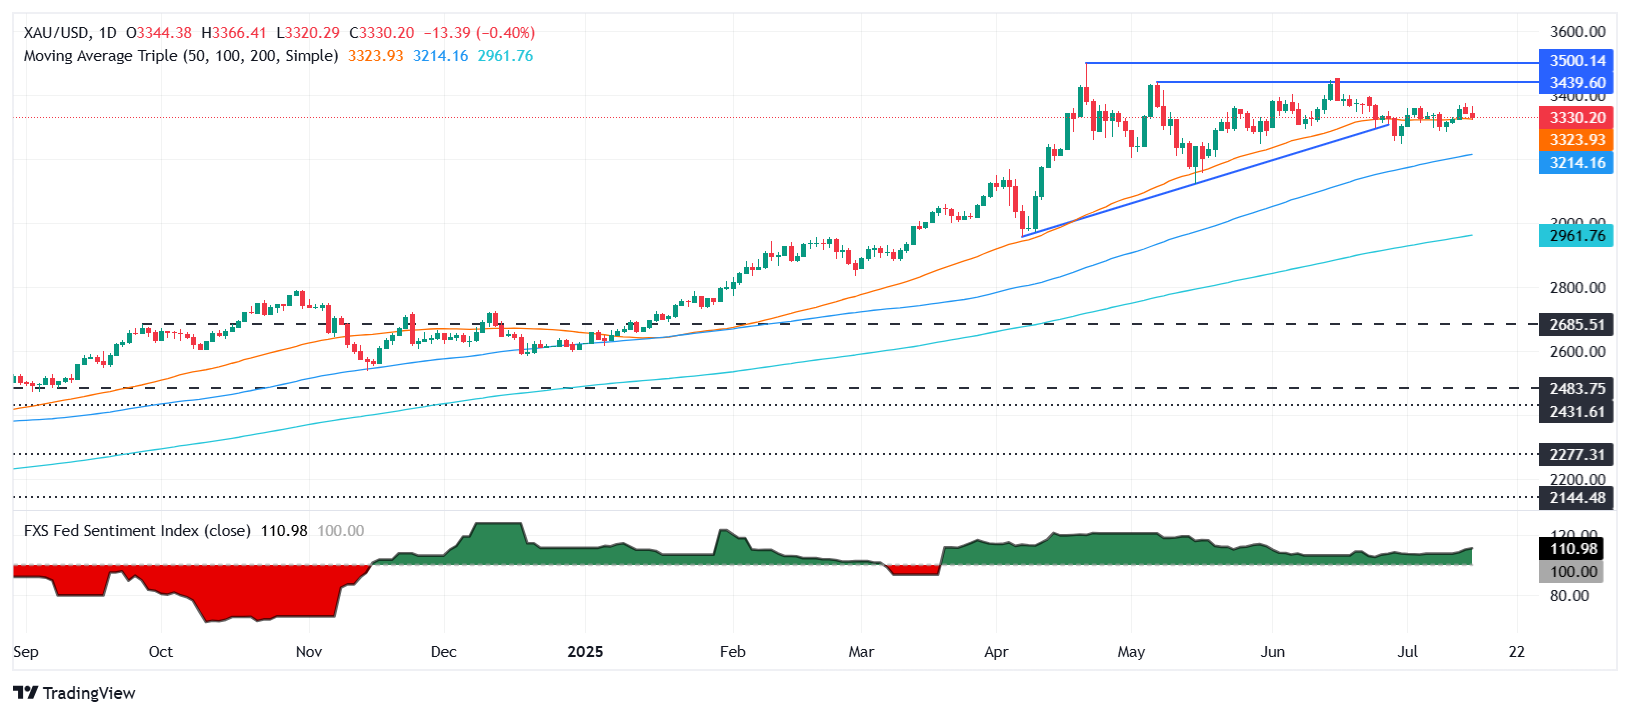
XAU/USD technical outlook: Gold price drops below the 20-day SMA
The Gold price uptrend remains intact, but the ongoing dip could threaten bulls if further downside is seen, with XAU/USD tumbling below the June 30 low of $3,246. The Relative Strength Index (RSI) has turned bearish, but it is flat, an indication that neither buyers nor sellers are in charge.
For a bearish continuation, Gold needs to clear $3,300. Up next lies the June 30 low and the May 16 swing low of $3,201. On the flip side, if XAU/USD rallies past $3,350, the next resistance would be $3,400, followed by $3,450 and the record high $3,500.
Gold FAQs
Gold has played a key role in human’s history as it has been widely used as a store of value and medium of exchange. Currently, apart from its shine and usage for jewelry, the precious metal is widely seen as a safe-haven asset, meaning that it is considered a good investment during turbulent times. Gold is also widely seen as a hedge against inflation and against depreciating currencies as it doesn’t rely on any specific issuer or government.
Central banks are the biggest Gold holders. In their aim to support their currencies in turbulent times, central banks tend to diversify their reserves and buy Gold to improve the perceived strength of the economy and the currency. High Gold reserves can be a source of trust for a country’s solvency. Central banks added 1,136 tonnes of Gold worth around $70 billion to their reserves in 2022, according to data from the World Gold Council. This is the highest yearly purchase since records began. Central banks from emerging economies such as China, India and Turkey are quickly increasing their Gold reserves.
Gold has an inverse correlation with the US Dollar and US Treasuries, which are both major reserve and safe-haven assets. When the Dollar depreciates, Gold tends to rise, enabling investors and central banks to diversify their assets in turbulent times. Gold is also inversely correlated with risk assets. A rally in the stock market tends to weaken Gold price, while sell-offs in riskier markets tend to favor the precious metal.
The price can move due to a wide range of factors. Geopolitical instability or fears of a deep recession can quickly make Gold price escalate due to its safe-haven status. As a yield-less asset, Gold tends to rise with lower interest rates, while higher cost of money usually weighs down on the yellow metal. Still, most moves depend on how the US Dollar (USD) behaves as the asset is priced in dollars (XAU/USD). A strong Dollar tends to keep the price of Gold controlled, whereas a weaker Dollar is likely to push Gold prices up.